2018 AFDR: How Do You Rate?

Measure your recruitment against 142 brands
Results from the 2018 Annual Franchise Development Report (AFDR) were unveiled in mid-October at the 19th annual Franchise Leadership & Development Conference. The 2018 AFDR is based on responses from 142 franchisors representing 85,734 units (74,000 franchised and 11,734 company-owned).
Participants in the survey consisted of franchisors that completed an online questionnaire. Responses were aggregated and analyzed to produce a detailed look into the recruitment and development practices, budgets, and strategies of a wide cross-section of franchisors. The data and accompanying commentary and analysis provide the basis of the 2018 AFDR.
Highlights from the report were presented in a general session at the conference by Franchise Update Media Executive Vice President Diane Phibbs. Other aggregated high-level observations gleaned from this year’s survey included:
- 1,209 domestic locations transferred
- 820 franchises sold 45 days before close of the survey
- 400 franchises sold through brokers in the past 12 months.
For 2018, growth plans among the 142 respondents target a total of 6,551 additional franchise units, 2,064 through existing franchisees and 3,926 from new franchisees. That compares with last year’s target of 6,536 additional franchise units from 167 respondents, 2016’s target of 6,442 additional units from 134 brands, and 2015’s target of 6,063 new units from 139 brands.
Below are additional highlights from the 2018 AFDR. Ordering information can be found on page 36. (Conference attendees each receive a complimentary copy.)
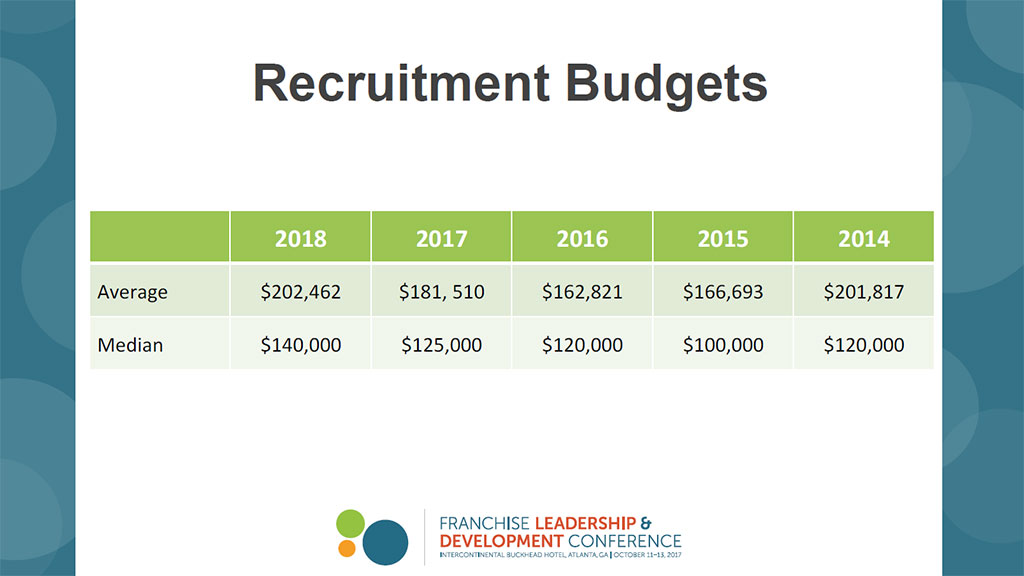
Recruitment budgets. Average 2018 media budget plans for franchise sales and recruitment (advertising and media expenses, not including brokers and employee compensation) among respondents was $202,462, with a median of $140,000. This is an increase from last year, where the corresponding numbers were $181,510 and $125,000—although the average is comparable to 2014. This likely indicates heightened competition—not only for quality candidates, but also higher internal costs stemming from the higher salaries and commissions required to attract and retain the best salespeople. While the numbers are up, the average is about the same as 4 years ago, though the median cost is the highest in the past 5 years.
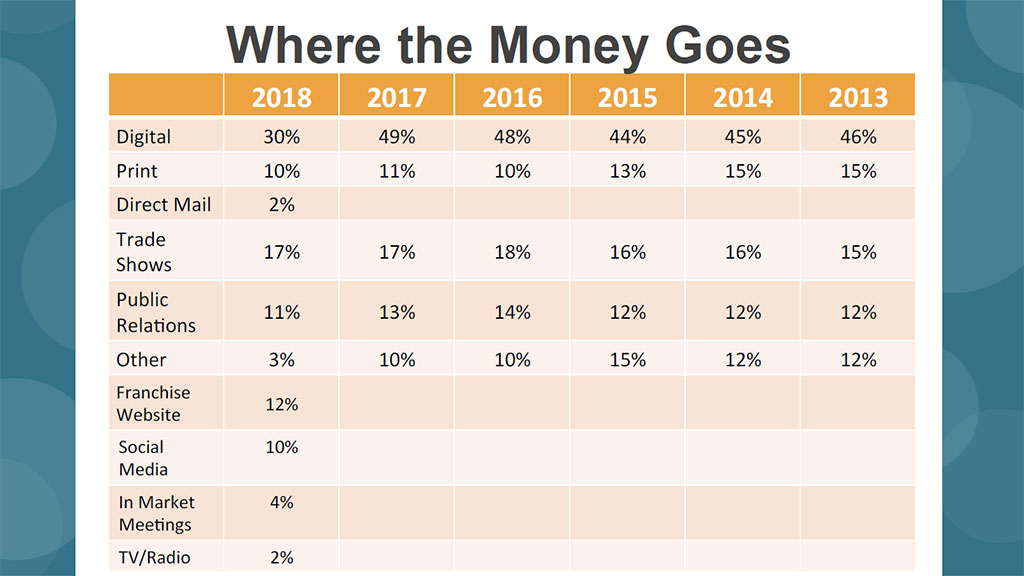
Where the money goes. With the increased emphasis and steady shift to online recruitment methods, we did something new this year: we broke out spending on franchise websites and social media from the “digital” category. Adding back spending on franchise websites (12 percent) and social media (10 percent) shows a total of 52 percent on overall digital spend, up slightly from previous years. We also added three new categories this year to provide finer granularity—direct mail, in-market meetings, and TV/radio—which subsequently reduced the “other” category. Spending on print (10 percent), trade shows (17 percent), and public relations (11 percent) has remained essentially the same over the past 6 years, with print showing a gradual decline as digital takes a greater share.
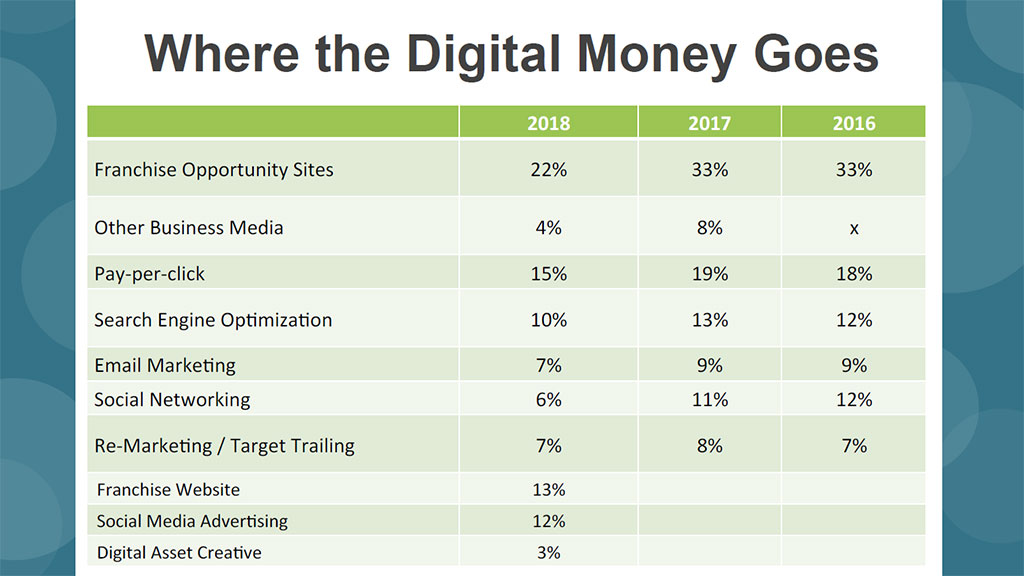
Where the digital money goes. In recent years, as digital spending has accounted for an increasing percentage of recruitment budgets, we’ve asked franchisors to break out their digital spending by category. And this year, as we’ve done with overall spending (above), we’ve added new categories that used to be included in other numbers—franchise website (13 percent), social media advertising (12 percent), and digital asset creative (3 percent)—making direct comparisons with previous years more difficult, but also providing a deeper look into where development budgets are headed. This also reduced the “other” category. Next year’s AFDR will provide one-to-one comparisons year over year for these new categories.
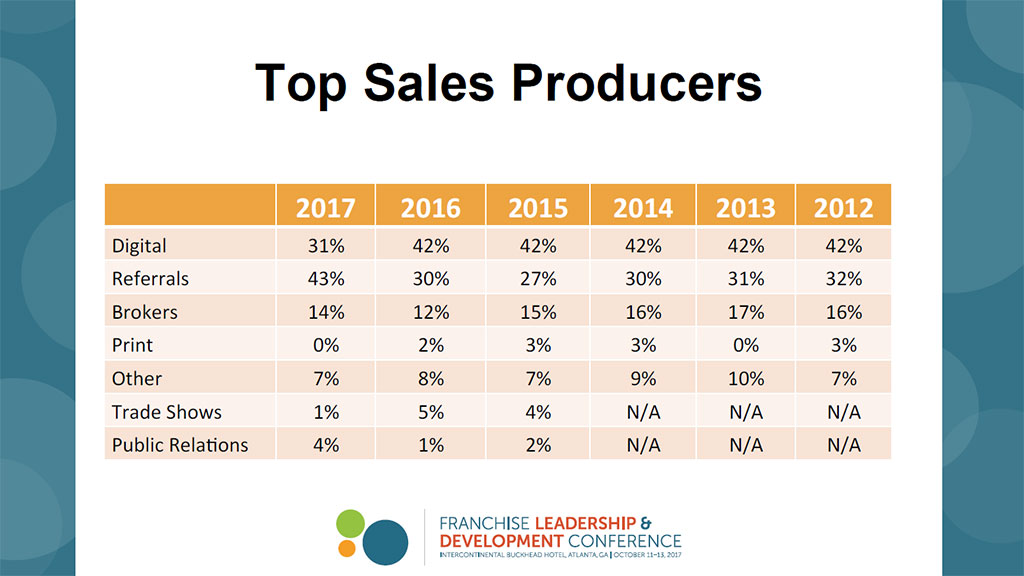
Top sales producers. After taking the lead in 2012 as the top sales producer, digital took a hit in 2017, dropping from a remarkably steady 42 percent to just 31 percent this year. Yet, with the inexorable reliance on digital, this begs the question of attribution, noted Phibbs. “Where do leads really come from?” she asked. “Where do they learn about the brand before they fill out the form on your website?” As Franchise Update Media Chair Gary Gardner pointed out 2 years ago, “The last click gets the credit.” He urged attendees to consider the extent to which their other efforts contribute to the more easily measured digital share of spending on sales. The other big difference from previous years is referrals—considered the strongest source of high-quality leads—which rose from about 30 percent in previous years to 43 percent this year.
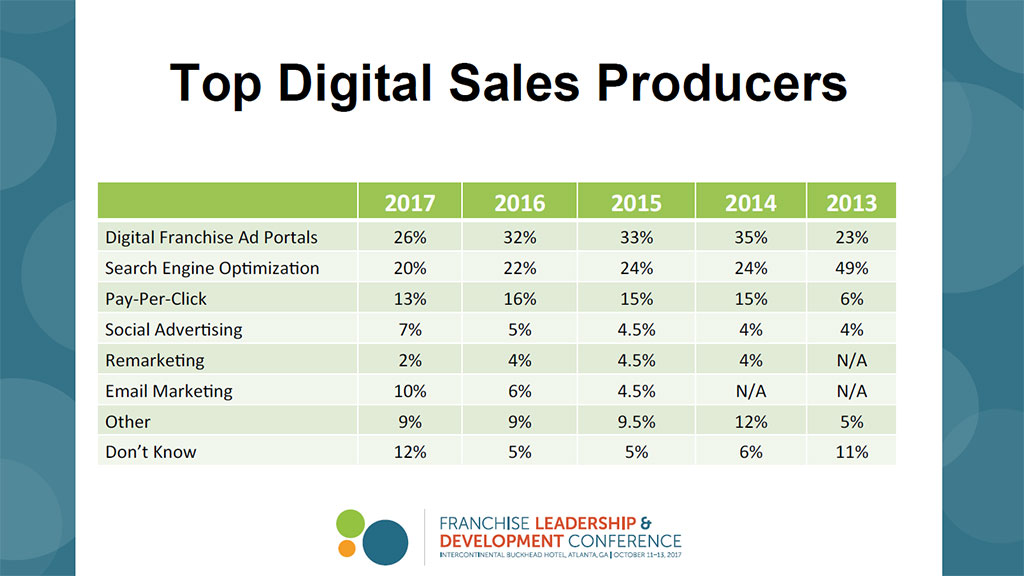
Top digital sales producers. We asked respondents to segment their digital spending as it relates to sales. Nothing startling here, but two trends to note over the past 5 years: 1) portals, after rising to account for about one in three sales in the past 3 years, fell to about one in four this year (26 percent); and 2) email marketing as a source of sales has risen steadily over the past 3 years, and at 10 percent has more than doubled from 2 years ago. (Perhaps the recent flurry of articles about email still being an effective medium for sales is worth paying attention to?) Oddly, in this era of more data than we know what to do with, the “don’t know” category more than doubled from the past 2 years and is back to where it was in 2013. Again, it may be worth looking into attribution. If you don’t know where more than one in 10 of your sales is coming from, there’s room for improvement.
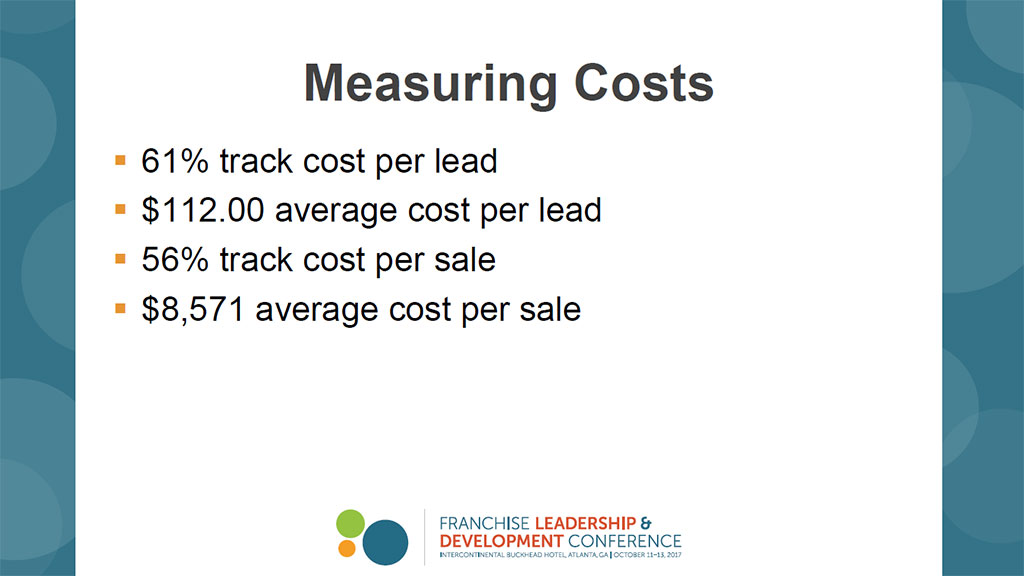
Measuring costs. About six in 10 respondents (61 percent) said they track cost per lead (identical with last year), while 56 percent track cost per sale (57 percent last year). This means that four in 10 respondents still do not track their cost per lead, and slightly more don’t track cost per sale. With all due respect to franchise sales teams, are you kidding? To repeat our observations from last year, franchise recruitment experts continue to shake their heads and wonder how any professional sales team can set a budget, spend the money, and not measure the effectiveness of that effort. Why 100 percent of brands don’t track these critical metrics remains a mystery—and could be one reason that so many development departments continue to miss their annual sales goals. Among the six in 10 who do track these numbers, the average cost per lead reported in this year’s survey was $112, about the same as last year’s $109. However, the average cost per sale of $8,571 was up significantly from last year’s $7,558 (which was up from $6,300 the year before). So cost per lead remained about the same, but cost per sale continues to rise.
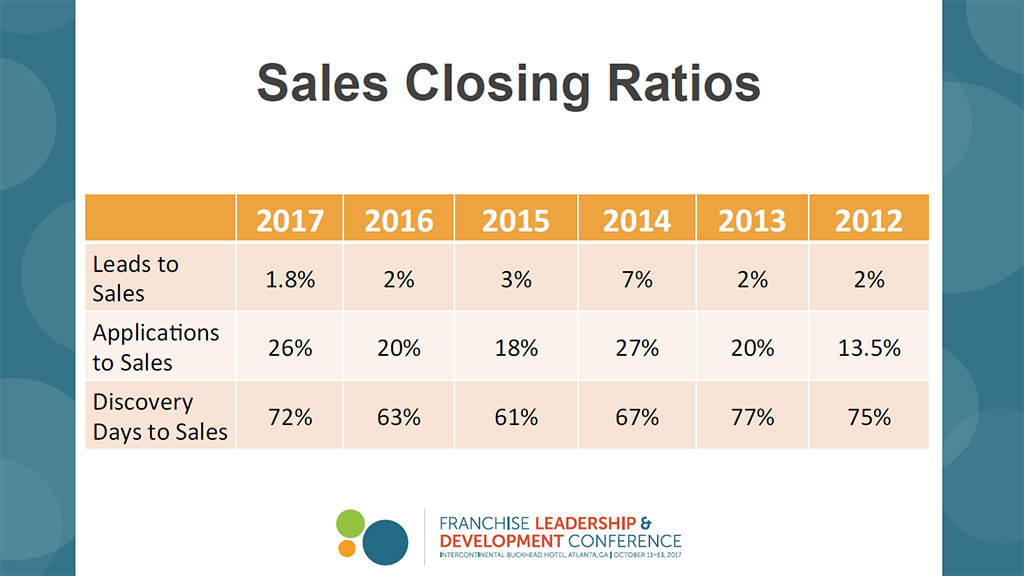
Sales closing ratios. How about some good news? Applications-to-sales ratios and discovery days-to-sales ratios were both noticeably higher this year. The leads-to-sales ratio fell slightly though, for the second consecutive year. (Note: In 2014, our panel of experts categorized that year’s figures as unusually high, more of an aberration than a norm.) The biggest trend here is the steady increase in the applications-to-sales ratio, which rose to 26 percent from 20 percent last year, nearly matching even those 2014 numbers, and almost doubling from 2012. And while the ratio for discovery days to sales, at 72 percent, was up nearly 10 percent from last year’s 63 percent, it still fell short of the ratios reported in 2012 and 2013. Many factors contribute to closing ratios, so no hard conclusions to be drawn here. For perspective, two years ago we wondered if more unfit candidates were making it through to discovery days; if franchisors were becoming more selective in the final stage of the award process; or if the economy and financing issues were the reason for the declines. Last year asked if greater uncertainty during a sluggish economic recovery dampened the appetite for risk among candidates; if increased competition for prime real estate for the many brands with similar footprints was contributing to the decline; and if pre-qualifiers were making a difference where the ratios had improved. Whatever the reasons, the silver lining here is that almost three in four candidates making it through to discovery day are signing deals. Still, we must ask, with all the stages in the sales process, prospects coming in with more information than ever, and more and more technology being deployed at each stage, could—should?—these numbers be higher?
Franchisors exceeding goals. Unlike last year, where brands exceeding their sales goals spent much less on cost per lead than the average ($76.50 vs. $109), this year’s “exceeders” spent more ($128 vs. $112). When it came to cost per sale, however, brands that exceeded their goals spent much less than the average when compared with the year before—$6,398 vs. an average $8,571 this year, compared with $6,266 vs. an average of $7,558 last year—so even though they spent slightly more than last year to close a deal, when measured against the average cost per sale, they performed relatively better in 2017. They also exceeded the average ratios for applications to sales (31 percent vs. 26 percent) and discovery days to sales (79 percent vs. 72 percent). Among other things, these numbers indicate that franchisors exceeding their goals are much more efficient in their recruitment spending than the average.
Franchisors Exceeding Goals
|
2017 |
2016 |
|
|
Cost per lead |
$128 (avg. $112) |
$76.50 (avg. $109) |
|
Cost per sale |
$6,398 (avg. $8,571) |
$6,266 (avg. $7,558) |
|
Applications-to-sales ratio |
31% (avg. 26%) |
15% (avg. 20%) |
|
Discovery day-to-sales ratio |
79% (avg. 72%) |
80% (avg. 63%) |
By segment, food brands (40 percent), despite dropping from the previous 2 years, continued to lead in the segments exceeding their goals. They were followed by service brands (25 percent for brick and mortar and 10 percent for territory/population). Finally, looking at money as a factor, 63 percent of those with an investment per unit above $250,000 exceeded their goals, compared with 57 percent in 2016, and 71 percent in 2015. A comparison of the “exceeders” with previous years by industry segment reveals the following:
|
Segment |
2017 |
2016 |
2015 |
|
Food |
40% |
44% |
59% |
|
Retail non-food |
5% |
9% |
11% |
|
Service (brick and mortar) |
25% |
30% |
15% |
|
Service (territory/population) |
10% |
9% |
11% |
|
Retail food |
20% |
9% |
4% |
|
Investment per unit > $250,000 |
63% |
57% |
71% |
9 Differentiators
The following are nine of the most important things more successful brands have seen or done in their franchise recruitment and development efforts that helped them to rise above the competition:
- Higher cost per lead, lower cost per sale
- Higher conversion rate of leads, applications, and discovery days
- 80 percent reported the quality of leads is up
- 95 percent described unit-level business conditions as good (68 percent of franchisors below goals described business conditions as good)
- Focused, strategic growth
- Use multiple marketing vehicles
- Use local marketing strategies
- Allocate dollars specifically to their franchise opportunity website
- Shop their competition
2018 Afdr Now Available!
The 2018 Annual Franchise Development Report (AFDR) delivers data collected from 142 franchisors representing 85,734 units, with responses organized by industry, unit investment, system-wide sales, and more. The annual report provides franchisors with the ideal tool for studying their development practices, benchmarking their sales and recruitment budgets against their own industry categories, and setting goals and budgets for the year ahead. The report also includes research into online recruitment practices, the growing use of mobile and social tools by prospects, and best practices by franchisors.
The AFDR, the only sales and lead generation benchmark report available in franchising, identifies industry sales trends and top lead generation sources for meeting sales goals. For example:
- How does your sales budget compare with other brands in your segment?
- Are your closing ratios in line with your industry and investment level?
- What conversion rates should you expect from your website?
- Is your online spending paying off? How do you know?
- Are your brokers delivering—and is their price per deal too high?
- Are you using referrals, and how much are you paying for them?
- How are franchisors using social media to recruit candidates?
- Some franchisors are exceeding their sales goals. What are they doing differently from those falling short?
The 2018 AFDR is packed with timely information and benchmarking data that can help your franchise system grow faster and close more deals—while saving thousands of dollars in cost per sale. Based on in-depth surveys from 142 franchise companies, this thoroughly researched report reveals the success drivers that are sure to boost the output and quality of your sales department.
Filled with the most comprehensive sales and lead generation data in franchising, the 2018 AFDR, at more than 250 pages, is a must-buy tool for franchisors, development consultants, and advertising, marketing, and technology suppliers—and is ideal for benchmarking and building budgets and media plans.
The complete 2018 AFDR, with analysis and benchmarks, is available for $350. For ordering information, call Sharon Wilkinson at 800-289-4232 x202 or email sales@franchiseupdatemedia.com.
Share this Feature


Recommended Reading:
Comments:
comments powered by Disqus
FRANCHISE TOPICS
- Multi-Unit Franchising
- Get Started in Franchising
- Growth
- Operations
- Open New Units
- Leadership
- Marketing
- Technology
- Legal
- Awards
- Rankings
- Trends
- Featured Franchise Stories
FEATURED IN
Franchise Update Magazine: Issue 4, 2017


Franchising.com is produced by Franchise Update Media. Franchise Update Media has its finger on the pulse of franchising with unrivalled audience intelligence and market driven data. No media company understands the franchise landscape deeper than Franchise Update Media.
P.O. Box 20547
San Jose, CA 95160
PH. (408) 402-5681
 The franchise listed above are not related to or endorsed by Franchise Update or Franchise Update Media Group. We are not engaged in, supporting, or endorsing any specific franchise, business opportunity, company or individual. No statement in this site is to be construed as a recommendation. We encourage prospective franchise buyers to perform extensive due diligence when considering a franchise opportunity.
Copyright © 2001 - 2024. All Rights Reserved. Legal Notices | Privacy Policy