Building a Financial Road Map
Treat the causes, not the symptoms
Seat-of-the-pants management styles may be fine themes for business magazine articles and their Hollywood adaptations, but responding to the symptoms of problems instead of preventing problems in the first place is like taking aspirin to cure pneumonia.
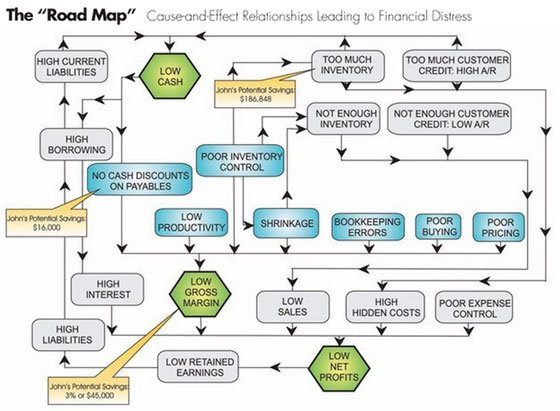
In the financial world, we often see symptoms such as low cash, low net profits, or both. But those symptoms are caused by something--and that's where the "Road Map" (see diagram) becomes useful. It represents the financial skeleton of your business.
As you can see, it's a self-contained system, but, as with any system, it requires maintenance to function properly. It presents a "big picture" overview, and it also leads us through a process of analysis designed to pinpoint potential problem areas. This cause-and-effect analysis is an invaluable resource for business owners.
A few words on how to read the Road Map. Between any two boxes, in the direction of the arrows, put in the word "causes." For example, "low cash" causes "high borrowing." Working in the opposite direction, add the words "is caused by" between the two boxes. For example, "high interest" is caused by "high borrowing."
Gross margin is highlighted for a reason. Without an adequate margin in the long term, you might as well hang it up. Not maintaining margin is almost always an issue--direct or indirect--in terms of problems. It's like a big star on the state map: all towns are important, but some are more important than others.
Meet the patient
To illustrate, let's look over the shoulder of our fictional friend "John Thomas" at John Thomas Jewelers as he works his way through the Road Map. John Thomas is a case study we use in our comprehensive financial workshop to illustrate common challenges.
Using some industry benchmarks he got at a financial workshop, John notes that his industry peers are achieving a gross margin of 50 percent compared with his 47 percent. Don't think a couple of percentage points of difference is small change. Multiply John's annual sales of $1.5 million by 3 percent and you'll get $45,000 that could have dropped right to his bottom line.
According to the Road Map, low gross margin is caused by: 1) no cash discounts on payables; 2) low productivity; 3) poor inventory control; 4) shrinkage; 5) bookkeeping errors; 6) poor buying, and/or 7) poor pricing.
Because John tends to be habitually short on cash, he doesn't often take advantage of the discount terms offered by his vendors (low cash caused by no discount on payables). A typical discount might be "2% 10/net 30," meaning that if John pays his vendor within 10 days, he will receive a 2 percent discount off the merchandise. "Net 30" means that if he doesn't take the discount, the net amount is due within 30 days. If John's purchases for the year totaled $825,000, he could have saved more than $16,000 (2% x $825,000) just by paying his vendors sooner.
Next stop, cash flow
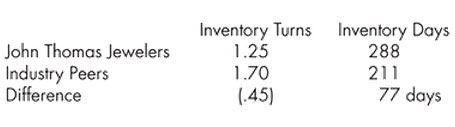
Since John has already shared with us that he ran into some cash crunches last year, let's look at what might be causing them. According to the Road Map, low cash is caused by high current liabilities, too much inventory, and/or too much customer credit. While John appears to have done a good job of managing customer credit, his inventory has gotten out of control.
How out of control? While his industry peers turned their inventory in 211 days, it took John 288 days to turn his. To find out why this 77-day difference is so crucial to his cash situation, let's do an analysis:
Using the formula for inventory turnover, which is the rate at which inventory is sold on an annual basis, we can use these numbers to find out what John's inventory savings would be if he could turn his inventory more efficiently:
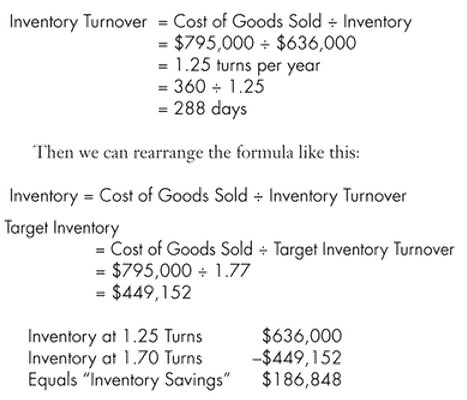
That's a whopping chunk of money! And if it weren't sitting in John's inventory, it would be available as much-needed cash. Furthermore, when you take the $186,848 excess inventory and divide it by the 77 days he lets it sit around, you get more than $2,400 for every day it sits in his cases.
Think of the ways he could have used that cash in his business--for instance, taking discounts from his vendors or paying off his credit line and avoiding extra interest. See how all of this is related? On the Road Map diagram, we've highlighted the areas and dollar amounts of potential "savings" that John could realize, if and when he manages these areas efficiently. Now, continue with "low cash" and take it in all directions until you've traveled all through the system. It's a fascinating journey, and the key is interdependence.
One size fits all
Keep in mind that my financial "skeleton" applies to any business. If some of these categories don't apply to you, simply leave them out. For instance, many stores may not have accounts receivable.
Many people visualize financial problems or issues as isolated occurrences. One of the primary benefits of this financial cause-and-effect diagram is that it highlights the interdependent nature of the financial system in your business. Remember, the diagram doesn't care how big your business is--it works for the neighborhood jeweler as well as the multi-unit franchisee.
Effective financial management falls somewhere between art and science. The goal is balance and control combined with intuition and risk-taking--and luck. But I've always considered "luck" as the point at which opportunity and preparation intersect. In other words, "The harder you work, the luckier you get!" To achieve and maintain balance and control, you'll need a cause-and-effect analysis.
Use this format to take a trip through your business. As with any trip, you can't reach your destination without a map, and that's what this framework is: a financial Road Map. You may find that it generates more questions than it answers. But that's good... because you can't solve problems until you know what to ask and where to look!
Do you have an issue that's related to the numbers side of your company? Send it in--we'll be sharing our responses to the most-asked questions in future articles.
Steve LeFever is the chair of Business Resource Services (BRS). For over 10 years franchisors and franchisees have improved their financial performance by following the BRS Profit Mastery process: financial training, performance benchmarking, and accountability/bankability modeling. Contact him at 800-488-3520 x14 or lefever@brs-seattle.com.
Share this Feature


Recommended Reading:
Comments:
comments powered by Disqus
FRANCHISE TOPICS
- Multi-Unit Franchising
- Get Started in Franchising
- Growth
- Operations
- Open New Units
- Leadership
- Marketing
- Technology
- Legal
- Awards
- Rankings
- Trends
- Featured Franchise Stories
FEATURED IN

Multi-Unit Franchisee Magazine: Issue 4, 2010


$20,000
$100,000

Franchising.com is produced by Franchise Update Media. Franchise Update Media has its finger on the pulse of franchising with unrivalled audience intelligence and market driven data. No media company understands the franchise landscape deeper than Franchise Update Media.
P.O. Box 20547
San Jose, CA 95160
PH. (408) 402-5681
 The multi-unit franchise opportunities listed above are not related to or endorsed by Multi-Unit Franchisee or Franchise Update Media Group. We are not engaged in, supporting, or endorsing any specific franchise, business opportunity, company or individual. No statement in this site is to be construed as a recommendation. We encourage prospective franchise buyers to perform extensive due diligence when considering a franchise opportunity.
Copyright © 2001 - 2024. All Rights Reserved. Legal Notices | Privacy Policy