2024 AFDR: Uncovering Franchise Development's Strengths and Weaknesses
Franchise Update Media unveiled its 2024 Annual Franchise Development Report (AFDR) at its Franchise Leadership & Development Conference (FLDC) in Atlanta.
For more than a decade, AFDR researchers have been surveying franchisors about their lead generation and franchisee recruitment processes. The project seeks to understand current lead generation and recruitment strategies, identify what’s new and innovative in franchise lead generation, recognize the methods and approaches yielding the best results, and gain insights into franchisors’ perspectives on current and future business performance.
Survey participants were franchisors who completed an in-depth questionnaire online. Responses were aggregated and analyzed to produce a detailed view into the recruitment and development practices, budgets, spending allocations, and strategies of a wide cross-section of franchisors. The data along with accompanying commentary and analysis provided the basis for the 2024 AFDR.
A total of 120 brands were included in the survey. The franchisors had 2,533 company-owned units and 24,101 franchise units. The brands represented a variety of segments, including food, retail food, nonfood retail, brick-and-mortar service, and service based on population and territory. Participants revealed plans to grow by a total of 2,046 franchise units in 2024.
Highlights from the report were presented by Franchise Update Media EVP and Chief Content Officer Diane Phibbs and Wild Birds Unlimited Chief Development Officer Paul Pickett in an FLDC general session in October. All conference attendees received a complimentary copy. The report can be ordered online at afdr.franchiseupdate.com.
Updates to this year’s survey include a further drill down into measuring salaries and areas of responsibility for the entire development team at the brands surveyed. Researchers also took a deeper dive into the broker data.
“The brand-new information on fran dev salaries and job responsibilities allows me to take a deeper and different look at my cost per lead, cost per application, and cost per sale metrics and provide me a baseline to use when developing my full 2024 budget,” Pickett said.
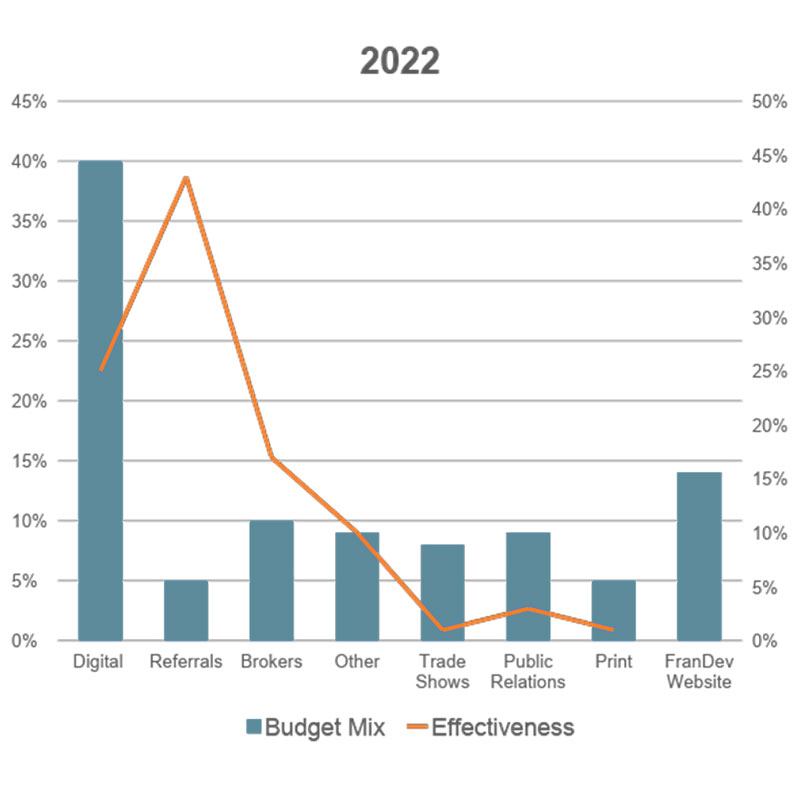
He noted a strong correlation between 2023’s spend and effectiveness of digital marketing. Pickett also mentioned the low spend yet high effectiveness of referrals.
Recruitment budgets
Franchisors were asked about their recruitment budgets for advertising efforts and development teams. Fifty-seven percent of brands report higher recruitment budgets for 2024 over 2023. Ad budgets have ticked upward for the past decade.
For 2024, the overall franchise development employee budget—including salaries, benefits, and bonuses—was reported to be $471,155. The overall franchise recruitment media budget was $263,409. The total franchise recruitment budget—not including brokers—was $734,564.
Franchisors also listed their 2024 sales goals as 43 locations/units with 72% new franchisees and 28% existing franchisees.
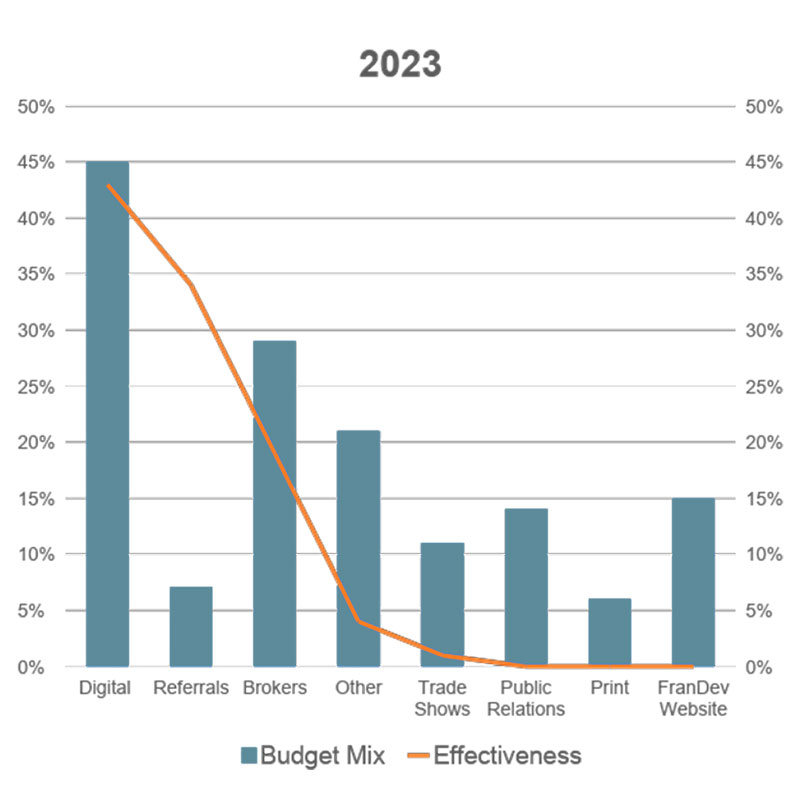
2023 media spend
Tracking ad spending and its effectiveness are important parts of an effective recruitment strategy. For 2023, the recruitment media spend as a percent of the budget was as follows:
- Digital, 45%
- Print, 6%
- Referrals, 7%
- Trade shows, 11%
- PR, 14%
- Brokers, 29%
- Email, 9%
- Direct mail, 3%
- Broadcast, 4%
- Franchise opportunity site, 15%
- Other, 5%
There’s no question that digital advertising dominates the budget spend and is an effective tool in franchise recruiting. But brands should also watch and nurture their efforts to recruit from referrals.
Measuring costs
Analyzing and measuring the costs associated with getting leads is an essential part of a franchise recruiting strategy. This year, the average cost per lead increased to $253, an increase from $155 last year, and the average cost per sale jumped from last year’s $10,086 to $11,639 this year.
“The increase in cost per lead suggests that brands are spending more to reach the right prospect,” Phibbs said. “Focused efforts to determine the ideal target audience will help identify the best marketing vehicles to reach them. There are a number of ways to identify target audiences, including reverse profiling of existing franchisees and segmentation research.”
Here are the numbers for both cost per lead and cost per sale:
- 59% track cost per lead (vs. 63% in 2022 and 50% in 2021)
- $253 average cost per lead (vs. $155 in 2022 and $97 in 2021)
- 46% track cost per sale (vs. 50% in 2022 and 44% in 2021)
- $11,639 average cost per sale (vs. $10,086 in 2021 and $9,270 in 2021)
That’s right, only 59% of the brands track cost per lead and only 46% tracked cost per sale. You can’t manage what you don’t measure, so there’s clear room for improvement.
Sales closing ratios
The ratios of leads to sales, qualified leads to sales, applications to sales, and discovery days to sales make up another critical set of metrics for evaluating the effectiveness of a franchise development team. Closing ratios improved slightly this year for all four categories. Leads to sales were almost half what they were last year. Lead quality is important, and brands with pre-qualifiers generally reported better closing ratios than those that didn’t employ them.
- Leads to sales: 1.8 percent (down from 3.5 % in 2022, 3.0% in 2021)
- Qualified leads to sales: 13% (up 2% from 2021)
- Applications to sales: 31% (31% in 2022 and 14% in 2021)
- Discovery days to sales: 73% (74% in 2022 and 66% in 2021)
In their presentation, Pickett and Phibbs suggested that because there is more targeted lead generation and market saturation, brands should do more focused marketing.
“Review your target audience to ensure they’re the right target,” Pickett said, and Phipps added, “Consider doing segmentation research for the target audience. This would be new for a lot of brands. Consider the lifetime value of a franchisee.”
Brokers
For the fourth year in a row, the survey asked participants about using brokers as a part of their recruiting. They were asked if they used brokers, how much they paid, what results they found, and their plans to use them in the future. This year, 44% of brands in the survey said they used brokers. The average broker spend was $78,700, including broker membership fees, marketing fees to drive leads to brokers, broker conference fees, and travel/hotel costs.
Brands worked with an average of 3.7 broker systems. Brands expected brokers to sell 34 deals, and 74% of brands said that broker networks had produced a sale in the past 12 months. Of those brands that used brokers, 85% do not track the success rate of franchisees closed from broker deals. Furthermore, Phibbs said, “Of the brands reporting they use brokers, so few submitted cost information that it was unusable.”
Franchisors who used brokers tracked the following metrics.
- Territory check to close: 20%
- Lead to close: 90%
- Applications to close: 27%
- Discovery day to close: 33%
Relationships are important, which is clearly the case with brokers. Results are also impacted by brand, sector, and franchise fee. Brokers, especially those specializing in franchise sales, have solid success rates. But franchisors who use them understand it’s a pay-to-play service.
Franchisors exceeding goals
A segment of those surveyed (16%) identified themselves as exceeding their franchise recruiting goals. Of those, more than nine out of 10 franchisors (94%) said their lead quality was up or the same. These franchisors said they closed deals from multiple lead sources.
Of the franchisors who exceeded their goals, 90% said they did so with the same or increased budget, 61% tracked their cost per lead, and 35% used brokers.
There was a tie for franchisors’ highest leads to close ratios with referrals and digital both coming in at 82% followed by brokers (18%) and trade shows (12%). “Franchisors exceeding goals report 18% of deals closed come from a broker lead. We have seen a pattern of 18% to 20% over the past three years,” Phibbs said.
These same brands were asked if they had a formal resale program (67% did) and if they had a program to recruit new franchisees for unit transfers (59% did).
AFDR at 30,000 feet
Franchise Update Media has surveyed franchisors about their franchise lead generation and recruitment processes every year for the past 10 years. This year, 120 brands were surveyed for the Annual Franchise Development Report. These brands represented a variety of segments, including food, retail food, nonfood retail, brick-and-mortar service, and service while factoring in population and territory.
Full survey results, including investment levels, unit counts, and system-wide sales reports, are available now.
Here are some highlights from the report:
Franchise lead generation & recruitment
Positive business outlook: Franchisors express a buoyant outlook on business growth. However, interest rates and inflationary pressures are obstacles to overcome going forward.
Digital dominance: In general, digital budgets remain consistent with a continued focus on lead generation through digital channels.
SEO & pay-per-click: These continue to dominate digital spending and deliver results for digital lead generation.
Social media & franchise portals: Both are potent forces in the digital landscape. Despite a decrease in portal budgets, they’re significant sources of successful deals.
Broker networks: 44% of survey respondents rely on brokers for franchisee recruitment or lead generation. The data shows that broker networks can fill a need in the lead generation process. Brands that exceed goals use brokers as part of their lead generation programs, but brokers are not the sole drivers of leads.
Multichannel media strategy: Employing diverse media channels for franchisee recruitment remains a successful strategy. Brands that adapt by directing funds to the most effective channels have higher chances of achieving their goals.
Smart outreach: Responsive franchisors recognize the importance of meeting prospects on multiple fronts. It’s all about being present wherever potential franchisees are looking. This multipronged approach ensures a broader reach and higher chances of successful conversions.
Cross-brand franchisees: Many franchise brands boast franchisees who are also franchisees with other systems. This cross-pollination means multi-unit operators with diverse backgrounds can apply their hard-earned skills and experience to benefit a variety of brands.
The role of financial performance representations (FPRs): Most franchisors acknowledge the crucial role of FPRs in their recruitment strategies, and a majority have integrated them into their processes.
High resale percentages: Franchise brands have seen significant resales. There could be multiple reasons, including brand maturity and changing market dynamics.
Franchise recruitment media budgets & performance insights Delayed media budget finalization: It’s noteworthy that a significant number of respondents—a larger percentage than ever observed—had yet to finalize their media budgets for franchise recruitment by the end of August 2023. The exact reasons for this delay require further exploration.
Positive trajectory: 53% of franchisors are either on target or exceeding their recruitment goals for the year.
Room for improvement: Conversely, 47% of respondents find themselves below their set recruitment goals. Future research is needed to investigate specific reasons for underperformance.
Social media deals: Social media’s influence remains strong in franchise recruitment. A considerable 46% of participants reported securing deals through these channels, emphasizing the importance of a robust online presence and strategy.
Adapting to rising costs: 23% of surveyed franchisors have implemented strategies to lessen initial expenses for potential franchisees, including
- reducing franchise fees
- cutting royalty fees
- minimizing build-out expenses
- introducing alternative build-out options
Share this Feature


Recommended Reading:
Comments:
comments powered by Disqus
FRANCHISE TOPICS
- Multi-Unit Franchising
- Get Started in Franchising
- Growth
- Operations
- Open New Units
- Leadership
- Marketing
- Technology
- Legal
- Awards
- Rankings
- Trends
- Featured Franchise Stories
FEATURED IN
Franchise Update Magazine: Issue 4, 2023


Franchising.com is produced by Franchise Update Media. Franchise Update Media has its finger on the pulse of franchising with unrivalled audience intelligence and market driven data. No media company understands the franchise landscape deeper than Franchise Update Media.
P.O. Box 20547
San Jose, CA 95160
PH. (408) 402-5681
 The franchise listed above are not related to or endorsed by Franchise Update or Franchise Update Media Group. We are not engaged in, supporting, or endorsing any specific franchise, business opportunity, company or individual. No statement in this site is to be construed as a recommendation. We encourage prospective franchise buyers to perform extensive due diligence when considering a franchise opportunity.
Copyright © 2001 - 2024. All Rights Reserved. Legal Notices | Privacy Policy